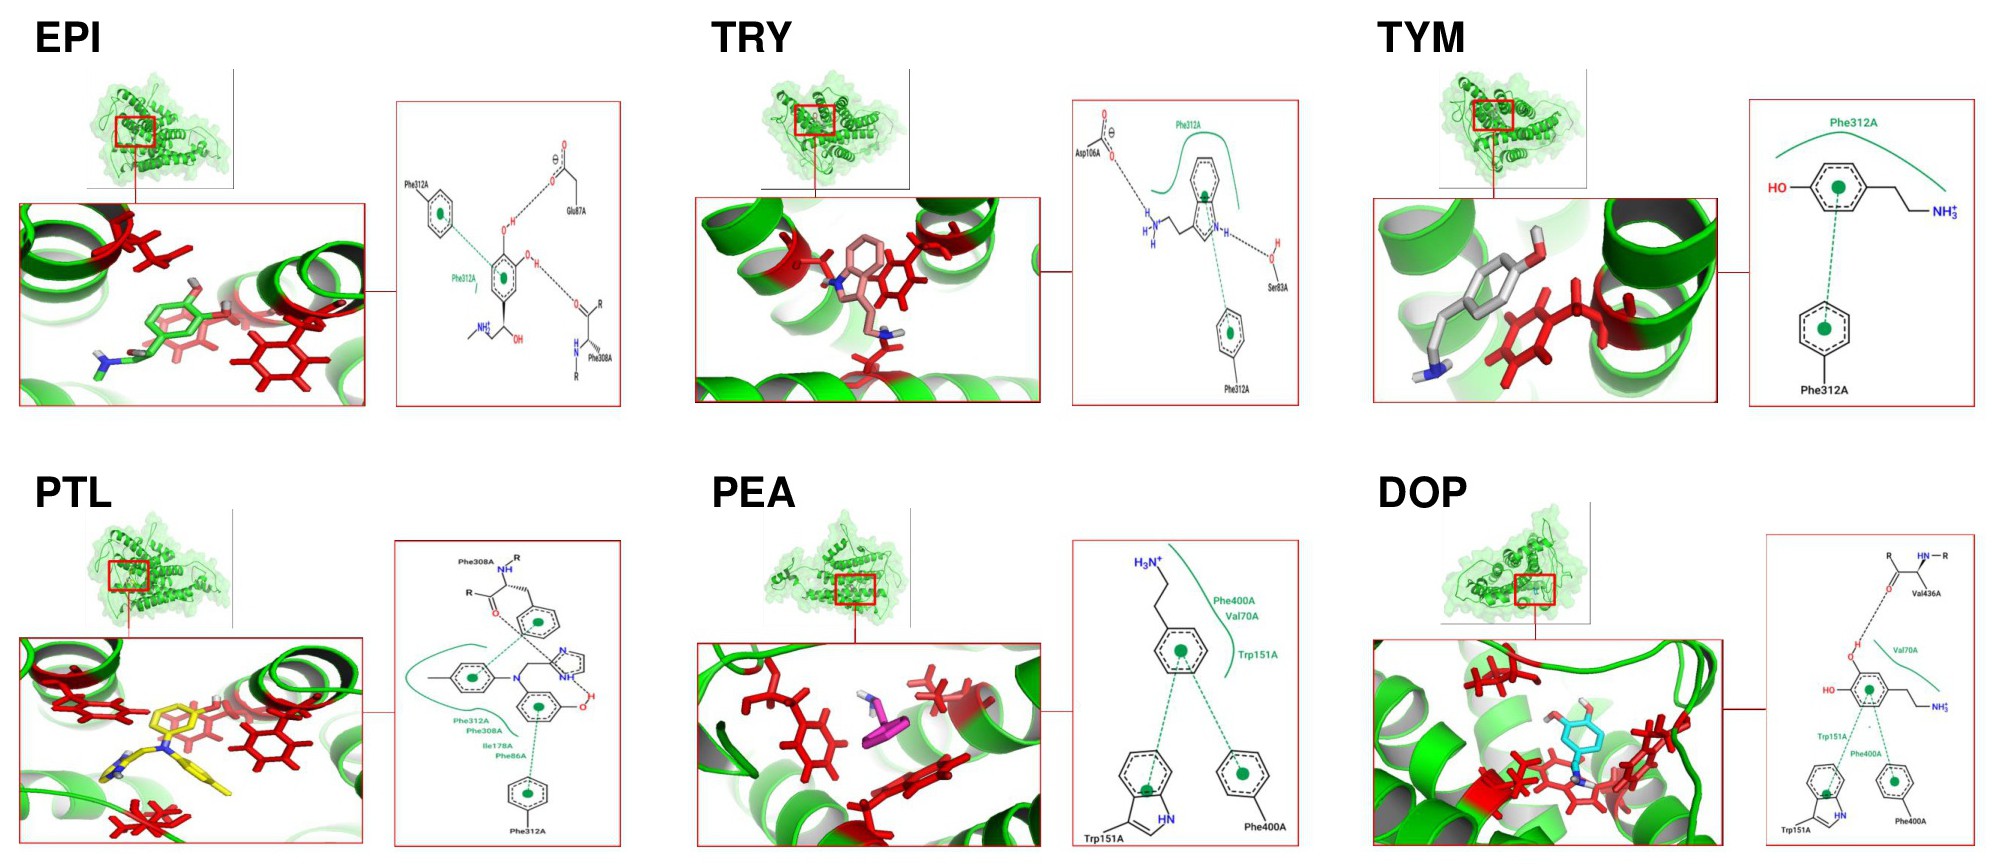
Fig. 1. Visualization of the predicted chemical interaction between ligands and a1-AR. The 3D structure of the protein was modeled using SWISS MODEL. The ligand and receptor interactions were analyzed using PyMol and PoseView. The green dotted lines represent hydrophobic interactions, the black dotted lines represent hydrogen interactions and the green lines with green font for amino acids represents the π interactions. The visualization was drawn using ChemSketch.